
How Old Are You Really? Chronological Age vs Biological Age Explained
Every year on your birthday, you add one to a number you've been counting since birth. But that number — your chronological age — only tells you how long the clock has been running. It says nothing about the condition of the system the clock is measuring. A 45-year-old who runs regularly, sleeps well, and has no chronic conditions can be biologically younger than a 35-year-old who doesn't. The number is the same for everyone born on the same day. What it represents is different for every one of them.
This article covers both sides of age: the simple arithmetic of how old you are in years, months, days, and hours — and what the research actually says happens inside the body at each stage of life. The two together give a more complete picture than either one alone.
Your Age in Different Units — What the Numbers Look Like
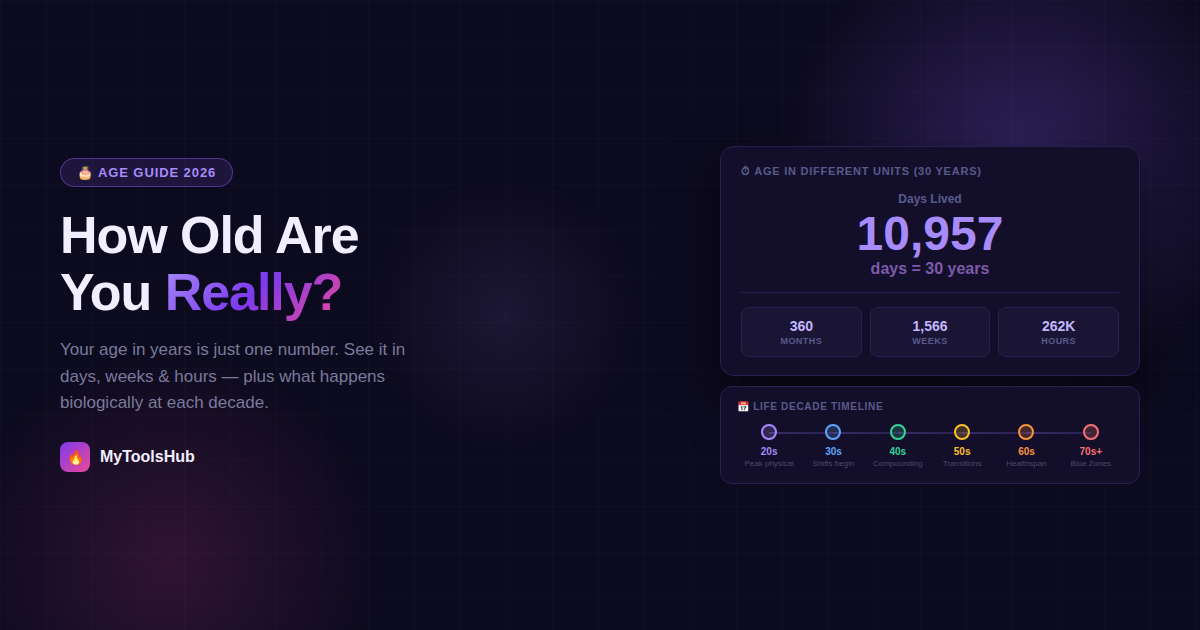
Most people know their age in years. Fewer think about what that number looks like in other units — and the perspective shift is surprisingly significant. Here's what 30 years of life actually represents:
The reason these alternative units are useful isn't just curiosity. Researchers who study time perception consistently find that people underestimate how much time they've lived and overestimate how much is left. Seeing 10,957 days rather than 30 years makes the passage of time more concrete — which is why some productivity frameworks deliberately use days as their unit of reference rather than years.
The Gap Between Chronological Age and Biological Age
In May 2025, a research team at the University of Washington School of Medicine published a new biological age measurement tool in Nature Communications, drawing on data from more than 40,000 people. Their Health Octo Tool found that existing measures of biological age, such as the Frailty Index, don't fully capture the complexity of biological aging — a finding that underscores how much more complicated real aging is than a single number suggests.
The distinction matters practically. The distinction between chronological and biological age has become central to modern ageing research. Although chronological age simply counts time, biological age aims to capture the molecular, physiological, and environmental changes that shape frailty and disease vulnerability.
Epigenetic clocks — tools that measure biological age through DNA methylation patterns — have become the leading method for quantifying this gap. Public interest in biological age has grown rapidly, yet important questions remain about the reliability of these measures in commercial wellness settings and how they should be used in clinical practice. The short version: commercial biological age tests give an interesting approximation, but the science is still maturing in terms of translating these measurements into actionable clinical guidance.
What Actually Happens Biologically at Each Decade
Different body systems peak and decline on different timelines. The pattern is more nuanced than the simple narrative of "things get worse after 30" — some systems are still improving well into middle age while others have been gradually changing since early adulthood.
The Age Units Table — A Quick Reference for Any Age
Here's how chronological age converts across common units for key milestone ages. All figures use approximate averages that account for leap years:
| Age (Years) | Months | Weeks | Days | Hours |
|---|---|---|---|---|
| 18 | 216 | 940 | 6,574 | 157,776 |
| 21 | 252 | 1,096 | 7,670 | 184,080 |
| 25 | 300 | 1,305 | 9,131 | 219,144 |
| 30 | 360 | 1,566 | 10,957 | 262,980 |
| 40 | 480 | 2,087 | 14,610 | 350,640 |
| 50 | 600 | 2,609 | 18,262 | 438,288 |
| 60 | 720 | 3,131 | 21,915 | 525,960 |
| 70 | 840 | 3,653 | 25,568 | 613,632 |
| 80 | 960 | 4,175 | 29,220 | 701,280 |
These figures are approximate — they use 365.25 days per year to account for leap years. For an exact count that matches your specific birth date to today's date, including the precise number of leap years in your lifetime, use an age calculator that works from your actual date of birth.
Lifespan vs Healthspan — The Distinction That Matters Most
Lifespan refers to the total number of years a person lives, while healthspan refers to the number of years lived in good health without major disease. This distinction is increasingly central to how researchers think about aging — because adding years to life without adding health to those years is a limited kind of progress.
Globally, the gap between lifespan and healthspan is significant. This means many people spend roughly 10 years managing chronic diseases or age-related health conditions. The implication is that the last decade of the average person's life is spent managing rather than thriving — and that closing this gap is arguably more valuable than extending total lifespan.
Average global lifespan: ~73 years
Average global healthspan: ~63–64 years
Gap: ~9–10 years spent managing chronic conditions
Japan (highest healthspan): ~74–75 years of healthy life
What determines healthspan more than lifespan? The evidence points consistently to a cluster of factors: physical activity, particularly resistance training to preserve muscle mass; sleep quality; not smoking; managing cardiovascular risk factors (blood pressure, blood sugar, cholesterol); and social connection. None of these is dramatic or expensive. All of them compound over decades.
What Blue Zone Populations Do Differently
Researchers have identified several regions known as Blue Zones, where people tend to live significantly longer than average. These include Sardinia (Italy), Okinawa (Japan), Nicoya (Costa Rica), Icaria (Greece), and Loma Linda (California). The people in these regions don't share a single diet or a specific exercise routine — they share a set of environmental and social conditions that make healthy behavior the default rather than an effort.
The consistent patterns across Blue Zones:
- Natural movement built into daily life — walking, gardening, and manual tasks rather than scheduled gym sessions
- Plant-dominant diets with meat as a small fraction of overall calories, not the centerpiece
- Strong social integration — belonging to a community, religious group, or multigenerational family structure
- A sense of purpose — having a reason to get up in the morning beyond obligation
- Moderate, consistent caloric intake — the Okinawan practice of hara hachi bu (eating to 80% full) is one formalization of this
What's notable is what this list doesn't include: specific supplements, medical interventions, or high-intensity fitness regimes. The longevity in Blue Zones appears to emerge from environmental design rather than individual willpower.
How Age Calculators Work — and Where They Can Be More Precise
The basic calculation behind any age calculator is subtraction: today's date minus your birth date. The complexity comes from two sources — months with different lengths, and leap years.
A year contains 365 days, except leap years (divisible by 4, with exceptions for century years divisible by 400) which contain 366. Someone born on February 28 in a non-leap year who wants to know their exact age on any given date needs a calculator that correctly handles whether the current year is a leap year and whether their birthday has occurred yet this year.
For most purposes, the approximation of 365.25 days per year is accurate enough. The exact day count for a specific person born on a specific date requires date-aware arithmetic that accounts for the actual calendar — which is what a properly built age calculator does automatically. The difference between an approximate and an exact calculation is typically 1–3 days, which matters if you're calculating days to a specific milestone but is irrelevant for most everyday uses.
Age Across Cultures — Why the Number Isn't Universal
The way age is counted isn't identical across all cultures, which is worth knowing for international contexts.
In East Asian age-reckoning systems — historically used in China, Korea, and Japan — a person is considered one year old at birth (the year in the womb counting as the first year), and everyone gains a year on the lunar new year rather than on their individual birthday. This means a person born in December under this system might be considered two years old in January, despite being only a few weeks old in the Western reckoning.
South Korea officially transitioned to the international (Western) age system in June 2023, after decades of using the East Asian system in daily life. This means some Koreans effectively became one or two years younger overnight in legal and official contexts — a notable reminder that the age number isn't as fixed as it appears.
For most practical purposes globally — passports, legal documents, medical records, age-restricted activities — the international system (years since date of birth) is the standard. But the cultural context is worth knowing, particularly for anyone working across East Asian markets or doing cross-cultural age comparisons.
Legal Age Milestones Around the World — A Global Reference
Chronological age unlocks different rights and responsibilities at different points in different countries. Here's how key milestones compare internationally — a reference that's useful for anyone navigating legal age thresholds across borders:
| Milestone | United States | United Kingdom | India | Japan | Germany |
|---|---|---|---|---|---|
| Legal adulthood | 18 | 18 | 18 | 18 (since 2022) | 18 |
| Voting age | 18 | 18 | 18 | 18 | 18 (16 in some states) |
| Driving (car) | 16–17 | 17 | 18 | 18 | 18 (17 with supervision) |
| Legal alcohol consumption | 21 | 18 | Varies by state (21 most) | 20 (proposed: 18) | 16 (beer/wine), 18 (spirits) |
| Retirement age (full benefits) | 67 | 66–67 | 60–62 (govt) | 65 | 67 |
Japan is worth noting specifically: it lowered the age of adulthood from 20 to 18 in April 2022 — one of the most significant legal age changes in any developed country in recent decades. This affected voting, contracting, and several other legal rights for millions of young Japanese citizens overnight.
Germany's approach to alcohol is one of the most graduated globally — beer and wine at 16, spirits at 18 — reflecting a policy philosophy that distinguishes between different types of alcohol rather than applying a single threshold. The US, by contrast, has one of the highest drinking ages among developed nations at 21, a legacy of the 1984 National Minimum Drinking Age Act.
The Leap Year Problem — Why Your Exact Age in Days Is Never Simple
Every age calculator that gives you a day count is doing more arithmetic than it appears. The complication is leap years — years with 366 days instead of 365, which occur every four years with exceptions for century years not divisible by 400.
For someone born on any day other than February 29, leap years simply add one extra day to specific years in their life. Someone who has lived through 7 leap years (roughly ages 0–28) has lived 7 extra days compared to what a flat 365-days-per-year calculation would give. Over a lifetime of 80 years, the cumulative difference is about 20 extra days — not enormous, but enough to make "multiply years by 365" a genuinely inaccurate method for precise day counts.
People born on February 29 — leap day babies — face their own particular situation. They have a "real" birthday only once every four years. In legal terms, most jurisdictions define their birthday as either February 28 or March 1 in non-leap years for age-related purposes like driving licenses and alcohol purchase. The UK and Hong Kong use March 1; most US states use February 28. This means the same person can legally become an adult on different days depending on which country they're in.
Years divisible by 4 are leap years — except century years (1700, 1800, 1900) — unless they're divisible by 400 (2000 was a leap year; 1900 was not). The next leap year after 2024 is 2028.
Frequently Asked Questions
How do I calculate my exact age in days?
Multiply your completed years by 365, add the days since your last birthday, and add one extra day for each leap year in your lifetime. For a precise result, an age calculator handles this automatically using your exact date of birth — the difference between approximation and exact calculation is typically 1–3 days.
What is the difference between chronological age and biological age?
Chronological age is simply the number of years since your birth. Biological age reflects the actual condition of your cells, organs, and physiological systems relative to population averages. Two people born on the same day can have biological ages differing by a decade based on lifestyle, genetics, and environment.
At what age does the human body start declining?
Different systems decline at different rates. Reaction time peaks in the early 20s. Muscle mass begins declining slowly around 30. Bone density starts declining in the 30s. Cardiovascular efficiency and lung capacity decline gradually from the 30s onward. Cognitive processing speed peaks around 18 but verbal ability and emotional regulation often continue improving well into middle age.
What is healthspan?
Healthspan is the number of years lived in good health — free from significant chronic disease or disability. Globally, the gap between lifespan and healthspan is roughly 9–10 years, meaning many people spend the final decade managing chronic conditions. Longevity research increasingly focuses on extending healthspan rather than just total lifespan.
How many days old am I if I am 25?
Approximately 9,131 days (25 years × 365.25 days/year). The exact figure depends on how many leap years fall within your specific birth date range and how many days have passed since your last birthday. Use an age calculator with your exact date of birth for a precise number.
Alongside your age, you might find it useful to check your BMI and BMR — together these give you a snapshot of where your body stands relative to healthy benchmarks at your current age.

Comments (0)
Leave a Comment